Generate Power BI Report
Visual Planner has a native integration with Microsoft Power BI. In the Reports section, click “Show Analytics” to launch a sample report.
Requirement: The desktop version of Microsoft Power BI must be installed. Click here for install link and instructions
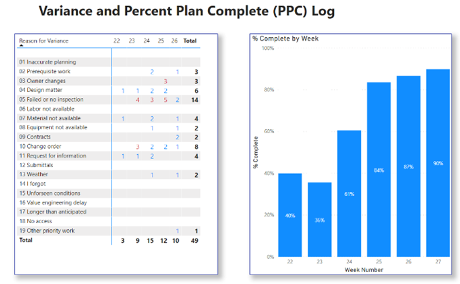
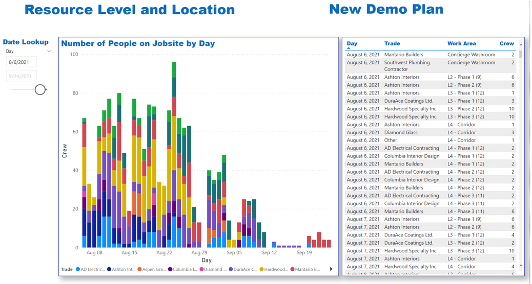
The sample file contains several pages/dashboards with reports. These sample reports can be customized. Power BI also has the ability to filter and sort plan data.
To make this custom report your new standard report that can be launched from NVP, save it as a template file with name “NVP_report.pbit” in the folder that’s listed in “Export path”
Step 1
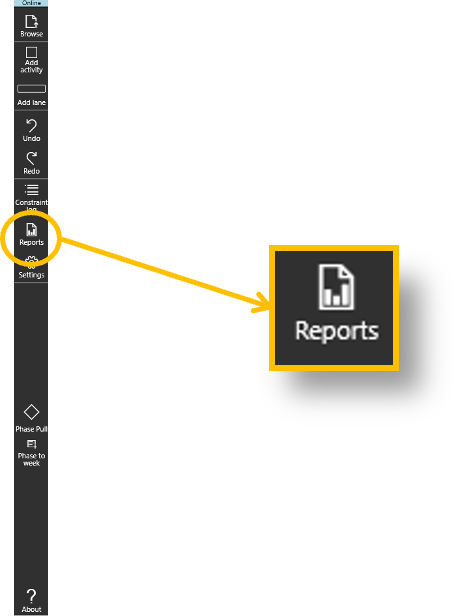
- Select Reports from the menu
Step 2
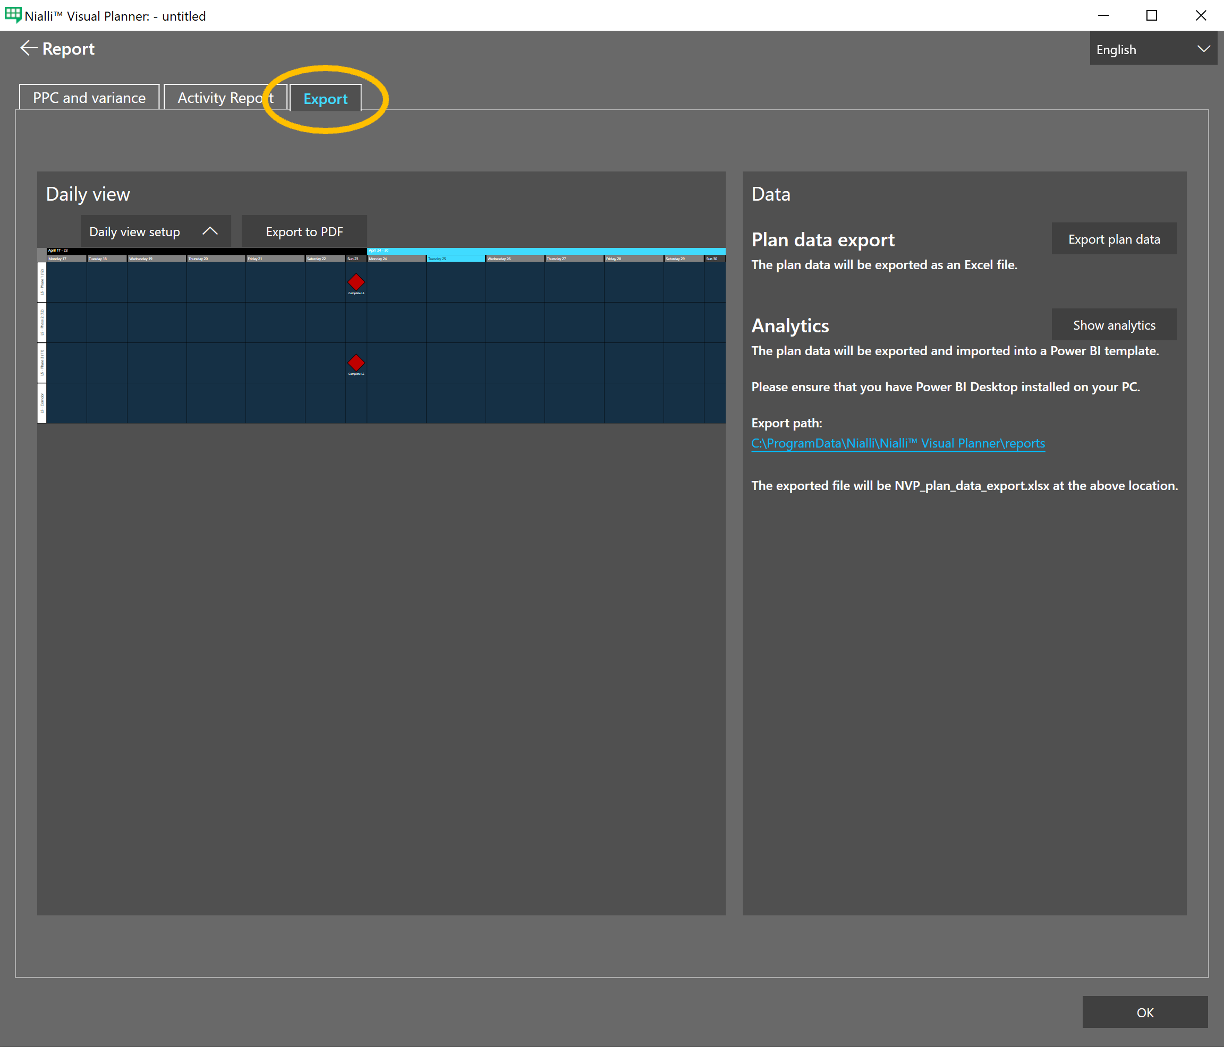
- Select the Export tab
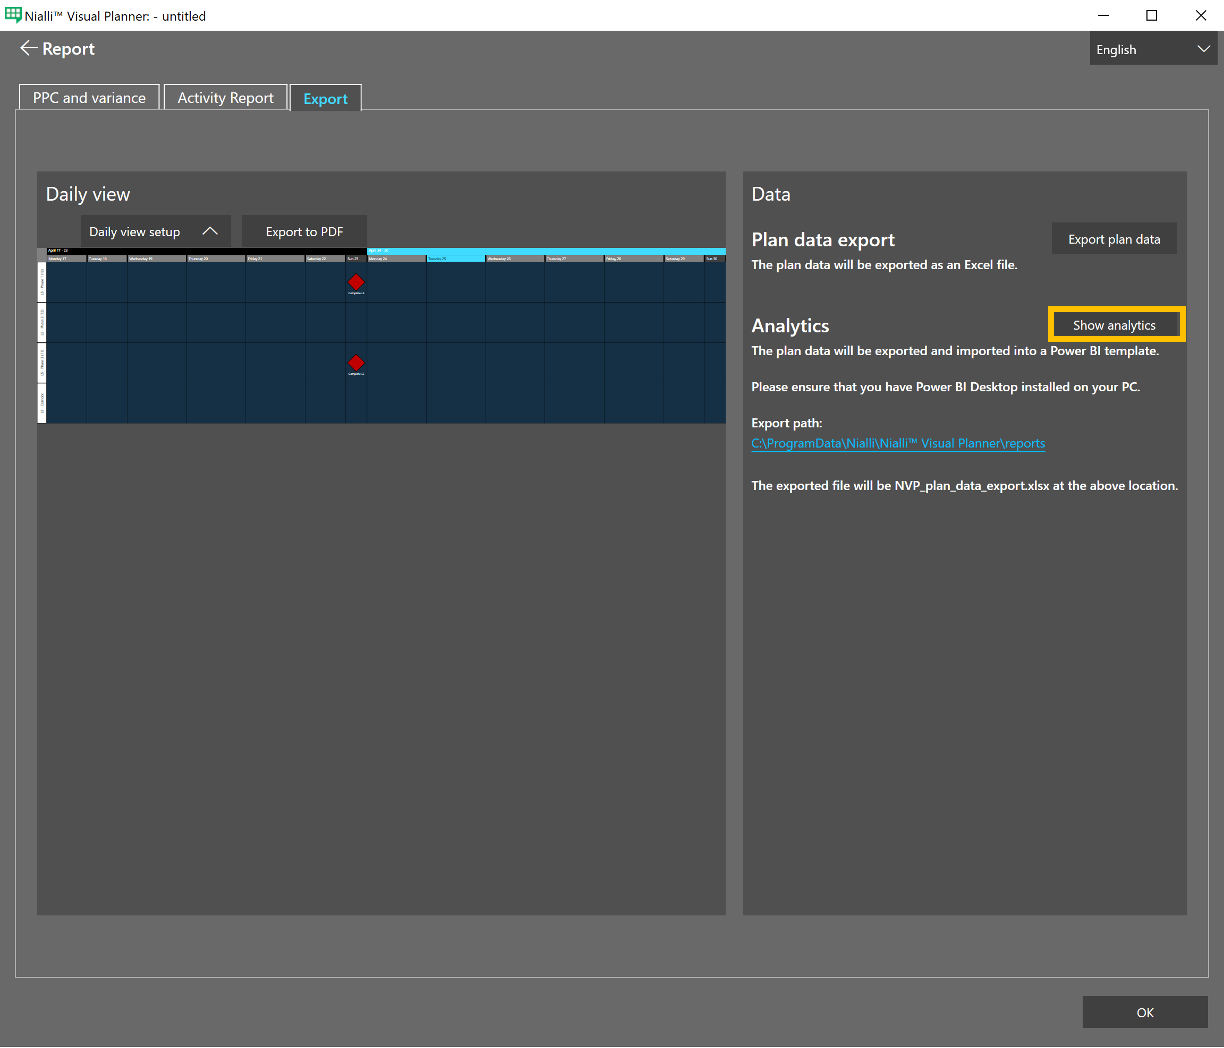
- Select the Show analytics